


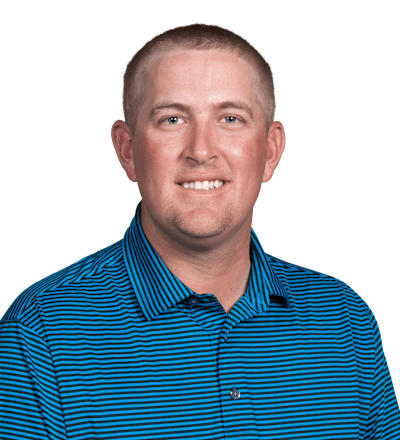
BrianMaurer
Country

United States
Age
39Turned Pro
2009Birthplace
Richmond, INCollege
Ball State UniversityKorn Ferry Tour Wins
0Wins (2016)
0Top 10 (2016)
0
World Rank
(OWGR)
-United States
Brian Maurer
Brian Maurer
United States
Stat Rankings
| STAT | RANK |
|---|---|
SG: Total -2.586 | - |
SG: Off The Tee -.226 | - |
| - | |
SG: Putting -1.701 | - |
Total Driving 1,998 | - |
Driving Distance 271.8 | - |
Driving Accuracy 60.71% | - |
GIR % 77.78% | - |
Proximity 32' 3 | - |
Approach > 200 yds 68' 8 | - |
Scrambling 25.00% | - |
| - | |
| - | |
Putting Avg 1.821 | - |
Putts Per Round 33.00 | - |
One-putt % 22.22% | - |
Scoring Average 73.00 | - |
Par 4 4.15 | - |
Birdie Average 3.00 | - |
| - |
SG: Total
-
-2.586
Field AVGSG: Off The Tee
-
-.226
Field AVGSG: Approach to Green
-
.122
Field AVGSG: Putting
-
-1.701
Field AVGTotal Driving
-
1,998
Field AVGDriving Distance
-
271.8
Field AVGDriving Accuracy
-
60.71%
Field AVGGIR %
-
77.78%
Field AVGProximity
-
32' 3
Field AVGApproach > 200 yds
-
68' 8
Field AVGScrambling
-
25.00%
Field AVGSand Save %
-
-
Field AVGScrambling from rough
-
.00%
Field AVGPutting Avg
-
1.821
Field AVGPutts Per Round
-
33.00
Field AVGOne-putt %
-
22.22%
Field AVGScoring Average
-
73.00
Field AVGPar 4
-
4.15
Field AVGBirdie Average
-
3.00
Field AVGFedExCup Fall Points
-
-
Field AVG| STAT | VALUE | RANK | SUPPORTING STAT | VALUE |
|---|---|---|---|---|
| SG: Total | -2.586 | - | Total SG:T(-5.172) | Measured Rounds(2) |
| SG: Tee-to-Green | -.885 | - | SG:OTT(-.226) | Measured Rounds(2) |
| SG: Off-the-Tee | -.226 | - | Total SG:OTT(-.452) | Measured Rounds(2) |
| SG: Approach the Green | .122 | - | Total SG:APP(.243) | Measured Rounds(2) |
| SG: Around-the-Green | -.780 | - | Total SG:ARG(-1.560) | Measured Rounds(2) |
| SG: Putting | -1.701 | - | Total SG:Putting(-3.403) | Measured Rounds(2) |
| Longest Drives | 313 | 445 | Tournament(Sanderson Farms) | Round(1) |
| Driving Distance | 271.8 | - | Total Distance(1,087) | Total Drives(4) |
| Driving Distance - All Drives | 268.7 | - | Total Distance(7,524) | # of Drives(28) |
| Driving Accuracy Percentage | 60.71% | - | Fairways Hit(17) | Possible Fairways(28) |
| Left Rough Tendency | 11.11% | - | Total Left rough(3) | Possible Fwys(27) |
| Right Rough Tendency | 22.22% | - | Total Right rough(6) | Possible Fwys(27) |
| Distance from Edge of Fairway | 35' 10 | - | Total Distance (Feet)(393.833) | Total Strokes(11) |
| Club Head Speed | 115.03 | - | Total Club Head Speed(230.06) | Total Attempts(2) |
| Total Driving Efficiency | 1,998 | - | Carry Efficiency Rank(999) | |
| Greens in Regulation Percentage | 77.78% | - | Greens Hit(28) | # Holes(36) |
| Proximity to Hole | 32' 3 | - | Total Distance (feet)(1,160.583) | # of Attempts(36) |
| Approaches from > 275 yards | - | - | ||
| Approaches from 250-275 yards | 108' 2 | - | Total Distance (feet)(108.167) | # of Attempts(1) |
| Approaches from 225-250 yards | - | - | ||
| Approaches from 200-225 yards | 49' 0 | - | Total Distance (feet)(97.917) | # of Attempts(2) |
| Approaches from > 200 yards | 68' 8 | - | Total Distance (feet)(206.083) | # of Attempts(3) |
| Approaches from 175-200 yards | 22' 4 | - | Total Distance (feet)(111.583) | # of Attempts(5) |
| Approaches from 150-175 yards | 22' 11 | - | Total Distance (feet)(68.667) | # of Attempts(3) |
| Approaches from 125-150 yards | 21' 10 | - | Total Distance (feet)(196.167) | # of Attempts(9) |
| Approaches from 50-125 yards | 19' 3 | - | Total Distance (feet)(135.000) | # of Attempts(7) |
| Approaches from 100-125 yards | 21' 3 | - | Total Distance (feet)(84.917) | # of Attempts(4) |
| Approaches from 75-100 yards | 10' 8 | - | Total Distance (feet)(21.250) | # of Attempts(2) |
| Approaches from 50-75 yards | 28' 10 | - | Total Distance (feet)(28.833) | # of Attempts(1) |
| Approaches from inside 100 yards | 16' 8 | - | Total Distance (feet)(50.083) | # of Attempts(3) |
| Approaches from > 100 yards | 27' 10 | - | Total Distance (feet)(667.417) | # of Attempts(24) |
| Fairway Proximity | 26' 7 | - | Attempts(27) | |
| Rough Proximity | 52' 3 | - | Total Distance (inches)(4,386) | Attempts(7) |
| Left Rough Proximity | 50' 2 | - | Attempts(3) | |
| Right Rough Proximity | 53' 9 | - | Attempts(4) | |
| Approaches from > 275 yards (Rgh) | - | - | ||
| Approaches from 250-275 yards (Rgh) | - | - | ||
| Approaches from 225-250 yards (Rgh) | - | - | ||
| Approaches from 200-225 yards (Rgh) | 123' 6 | - | Total Distance (feet)(123.500) | # of Attempts(1) |
| Approaches from > 100 yards (Rgh) | 51' 0 | - | Total Distance (feet)(254.833) | # of Attempts(5) |
| Approaches from inside 100 yards (Rgh) | 55' 4 | - | Total Distance (feet)(110.667) | # of Attempts(2) |
| Approaches from > 200 yards (Rgh) | 123' 6 | - | Total Distance (feet)(123.500) | # of Attempts(1) |
| Approaches from 175-200 yards (Rgh) | 6' 6 | - | Total Distance (feet)(6.500) | # of Attempts(1) |
| Approaches from 150-175 yards (Rgh) | 54' 9 | - | Total Distance (feet)(109.500) | # of Attempts(2) |
| Approaches from 125-150 yards (Rgh) | 15' 4 | - | Total Distance (feet)(15.333) | # of Attempts(1) |
| Approaches from 50-125 yards (Rgh) | 55' 4 | - | Total Distance (feet)(110.667) | # of Attempts(2) |
| Approaches from 100-125 yards (Rgh) | - | - | ||
| Approaches from 75-100 yards (Rgh) | 55' 4 | - | Total Distance (feet)(110.667) | # of Attempts(2) |
| Approaches from 50-75 yards (Rgh) | - | - | ||
| Going for the Green | 10.00% | - | Attempts(1) | Non-Attempts(9) |
| Going for the Green - Hit Green Pct. | .00% | - | Successes(0) | Attempts(1) |
| Going for the Green - Birdie or Better | .00% | - | # of Birdie or Better(0) | Attempts(1) |
| Total Hole Outs | - | - | ||
| Longest Hole Outs (in yards) | - | - | ||
| Scrambling | 25.00% | - | Par or Better(2) | Missed GIR(8) |
| Scrambling from the Rough | .00% | - | Successes(0) | Attempts(3) |
| Scrambling from the Fringe | .00% | - | Successes(0) | Attempts(1) |
| Scrambling from > 30 yards | .00% | - | Successes(0) | Attempts(1) |
| Scrambling from 20-30 yards | .00% | - | Successes(0) | Attempts(1) |
| Scrambling from 10-20 yards | 33.33% | - | Successes(1) | Attempts(3) |
| Scrambling from < 10 yards | 33.33% | - | Successes(1) | Attempts(3) |
| Sand Save Percentage | - | - | ||
| Proximity to Hole from Sand | - | - | ||
| Total Putting | - | - | ||
| Putting Average | 1.821 | - | GIR Putts(51) | Greens Hit(28) |
| Overall Putting Average | 1.833 | - | # of Putts(66) | # of Holes(36) |
| Birdie or Better Conversion Percentage | 21.43% | - | # Birdies(6) | Greens Hit(28) |
| Putts Per Round | 33.00 | - | Total Putts(66) | Total Rounds(2) |
| Putts per Round - Round 1 | 34.00 | - | Total Putts(34) | Total Rounds(1) |
| Putts per Round - Round 2 | 32.00 | - | Total Putts(32) | Total Rounds(1) |
| Putts per Round - Round 3 | - | - | ||
| Putts per Round - Round 4 | - | - | ||
| One-Putt Percentage | 22.22% | - | # of 1 putts(8) | # of holes(36) |
| Longest Putts | 23' 0 | 366 | Year/Tourn#(Sanderson Farms) | Round(1) |
| 3-Putt Avoidance | 5.56% | - | Total 3 Putts(2) | Total Holes (overall)(36) |
| Putting from - > 25' | .00% | - | Attempts(10) | Putts made |
| Putting from - 20-25' | 25.00% | - | Attempts(4) | Putts made(1) |
| Putting from - 15-20' | 16.67% | - | Attempts(6) | Putts made(1) |
| Putting from - 10-15' | 16.67% | - | Attempts(6) | Putts made(1) |
| Putting - Inside 10' | 82.50% | - | Attempts(40) | Putts made(33) |
| Putting from 10' | 50.00% | - | Attempts(2) | |
| Putting from 9' | 100.00% | - | Attempts(1) | |
| Putting from 8' | .00% | - | Attempts(2) | |
| Putting from 7' | 100.00% | - | Attempts(2) | |
| Putting from 6' | 33.33% | - | Attempts(3) | |
| Putting from 5' | 33.33% | - | Attempts(3) | |
| Putting from 4-8' | 40.00% | - | Attempts(10) | Putts made(4) |
| Putting from 4' | 100.00% | - | Attempts(2) | |
| Putting from 3' | 100.00% | - | Attempts(25) | |
| Average Distance of Putts made | 69' 2 | - | Total Dist. (inches)(1,659) | Total Rounds(2) |
| Approach Putt Performance | 2' 7 | - | Attempts(28) | |
| Scoring Average (Adjusted) | 74.587 | - | Total Strokes(146) | Total Adjustment(3.173) |
| Scoring Average (Actual) | 73.00 | - | Total Strokes(146) | Total Rounds(2) |
| Lowest Round | 72 | 439 | Tourn/Course(Sanderson Farms) | Round(2) |
| Birdie Average | 3.00 | - | # of Birdies(6) | Total Rounds(2) |
| Total Birdies | 6 | - | ||
| Eagles (Holes per) | - | - | ||
| Total Eagles | 0 | - | ||
| Par Breakers | 16.67% | - | # Birdies/Eagles(6) | # Holes(36) |
| Bounce Back | 20.00% | - | ||
| Par 3 Birdie or Better Leaders | .00% | - | Par 3 Birdies or Better(0) | Par 3 Holes(8) |
| Par 4 Birdie or Better Leaders | 20.00% | - | Par 4 Birdies or Better(4) | Par 4 Holes(20) |
| Par 5 Birdie or Better Leaders | 25.00% | - | Par 5 Birdies or Better(2) | Par 5 Holes(8) |
| Birdie or Better Percentage | 16.67% | - | Total Birdies(6) | Total Holes(36) |
| Bogey Avoidance | 19.44% | - | Bogeys(7) | Holes Played(36) |
| Final Round Scoring Average | - | - | ||
| Final Round Performance | - | - | ||
| Round 1 Scoring Average | 74.00 | - | Total Strokes(74) | Total Rounds(1) |
| Round 2 Scoring Average | 72.00 | - | Total Strokes(72) | Total Rounds(1) |
| Round 3 Scoring Average | - | - | ||
| Round 4 Scoring Average | - | - | ||
| Par 3 Scoring Average | 3.00 | - | Total Strokes(24) | Total Holes(8) |
| Par 4 Scoring Average | 4.15 | - | Total Strokes(83) | Total Holes(20) |
| Par 5 Scoring Average | 4.88 | - | Total Strokes(39) | Total Holes(8) |
| Front 9 Scoring Average | 37.00 | - | Total Strokes(74) | Total Holes(2) |
| Back 9 Scoring Average | 36.00 | - | Total Strokes(72) | Total Holes(2) |
| Early Scoring Average | 73.00 | - | Total Strokes(146) | Total Early Rounds(2) |
| Late Scoring Average | - | - | ||
| Consecutive Cuts | - | - | ||
| Current Streak without a 3-Putt | 12 | 357 | ||
| Consecutive Fairways Hit | 3 | 526 | Current Streak(2) | |
| Consecutive GIR | 6 | 413 | Current Streak(0) | Round(1) |
| Consecutive Sand Saves | - | - | ||
| Best YTD 1-Putt or Better Streak | 2 | 527 | ||
| Best YTD Streak w/o a 3-Putt | 13 | 581 | Current Streak(12) | |
| YTD Par or Better Streak | - | - | ||
| Consecutive Par 3 Birdies | - | - | ||
| Consecutive Holes Below Par | 1 | 454 | ||
| Consecutive Birdies Streak | 1 | 451 | ||
| Consecutive Birdies/Eagles streak | - | - | ||
| Official Money | - | - |