


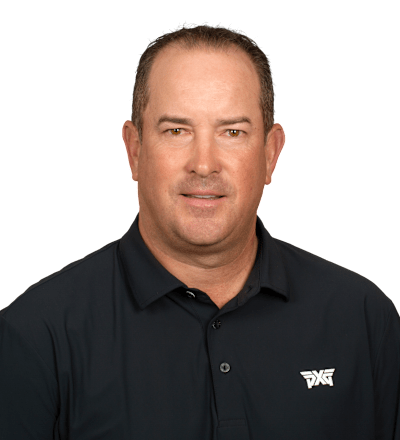
DaveCunningham
Country

United States
Age
57Turned Pro
-Birthplace
-College
-Career Wins
0Wins (2023)
0Top 10 (2023)
0World Rank
(OWGR)
-United States
Dave Cunningham
Dave Cunningham
United States
Stat Rankings
| STAT | VALUE | RANK | SUPPORTING STAT | VALUE |
|---|---|---|---|---|
| Total Driving | 1,998 | - | Distance Rank(999) | Accuracy Rank(999) |
| Longest Drives | 299 | 167 | Tournament(U.S. Sr Open) | Round(2) |
| Driving Distance | 259.9 | - | Total Distance(2,079) | Total Drives(8) |
| Driving Accuracy Percentage | 75.00% | - | Fairways Hit(42) | Possible Fairways(56) |
| Greens in Regulation Percentage | 62.50% | - | Greens Hit(45) | # Holes(72) |
| Scrambling | 40.74% | - | Par or Better(11) | Missed GIR(27) |
| Sand Save Percentage | 42.86% | - | # Saves(3) | # Bunkers(7) |
| Putting Average | 1.822 | - | GIR Putts(82) | Greens Hit(45) |
| Birdie or Better Conversion Percentage | 26.67% | - | # Birdies(12) | Greens Hit(45) |
| Putts Per Round | 30.50 | - | Total Putts(122) | Total Rounds(4) |
| Putts per Round - Round 1 | 31.00% | - | Total Putts(31) | Total Rounds(1) |
| Putts per Round - Round 2 | 30.00% | - | Total Putts(30) | Total Rounds(1) |
| Putts per Round - Round 3 | 30.00% | - | Total Putts(30) | Total Rounds(1) |
| Putts per Round - Round 4 | 31.00% | - | Total Putts(31) | Total Rounds(1) |
| Overall Putting Average | 1.694 | - | # of Putts(122) | # of Holes(72) |
| One Putt Percentage | 31.94% | - | # of 1 putts(23) | # of holes(72) |
| 3 Putt Avoidance | 4.17% | - | Total 3 Putts(3) | Total Holes (overall)(72) |
| Scoring Average (Actual) | 73.00 | - | Total Strokes(292) | Total Rounds(4) |
| Bounce Back | 11.11% | - | ||
| Bogey Avoidance | - | - | ||
| Round 1 Scoring Average | 74.00 | - | Total Strokes(74) | Total Rounds(1) |
| Round 2 Scoring Average | 72.00 | - | Total Strokes(72) | Total Rounds(1) |
| Round 3 Scoring Average | 73.00 | - | Total Strokes(73) | Total Rounds(1) |
| Round 4 Scoring Average | - | - | ||
| Par 3 Scoring Average | 3.44 | - | Total Strokes(55) | Total Holes(16) |
| Par 3 Birdie or Better Leaders | 6.25% | - | Par 3 Birdies or Better(1) | Par 3 Holes(16) |
| Par 4 Scoring Average | 4.07 | - | Total Strokes(179) | Total Holes(44) |
| Par 4 Birdie or Better Leaders | 18.18% | - | Par 4 Birdies or Better(8) | Par 4 Holes(44) |
| Par 5 Scoring Average | 4.83 | - | Total Strokes(58) | Total Holes(12) |
| Par 5 Birdie or Better Leaders | 33.33% | - | Par 5 Birdies or Better(4) | Par 5 Holes(12) |
| Front 9 Scoring Average | - | - | ||
| Back 9 Scoring Average | - | - | ||
| Early Scoring Average | - | - | ||
| Late Scoring Average | - | - | ||
| Lowest Round | 72 | 191 | Tourn/Course(U.S. Sr Open/Se) | Round(2) |
| Birdie Average | 3.25 | - | # of Birdies(13) | |
| Total Birdies | 13 | - | ||
| Birdie or Better Percentage | 18.06% | - | Total Birdies(13) | Total Holes(72) |
| Eagles (Holes per) | - | - | ||
| Total Eagles | 0 | - | ||
| Par Breakers | 18.06% | - | # Birdies/Eagles(13) | # Holes(72) |
| Scoring Average Final Rnd | 73.00 | - | Total Strokes(73) | Total Rounds(1) |
| Final Round Performance | .00% | - | ||
| Consecutive Fairways Hit | 8 | 133 | Current Streak(8) | |
| Consecutive Par 3 Birdies | 1 | 131 | ||
| Consecutive Holes below Par | 2 | 120 | ||
| Consecutive GIR | 8 | 129 | Current Streak(0) | Round(4) |
| Consecutive Sand Saves | 2 | 122 | Current Streak(1) | Round(1) |
| Best YTD Streak w/o a 3-Putt | 31 | 168 | Current Streak(14) | |
| Current Streak without a 3 Putt | - | - | ||
| YTD Par or Better Streak | - | - | ||
| Consecutive Birdies Streak | 2 | 108 | ||
| Consecutive Birdies/Eagles streak | - | - | ||
| Charles Schwab Cup Money List | $27,134 | 129 | YTD Victories | |
| 2025 Charles Schwab Cup Points | 27,134 | 129 | Pts. Behind Leader(3,958,929) | Wins |