



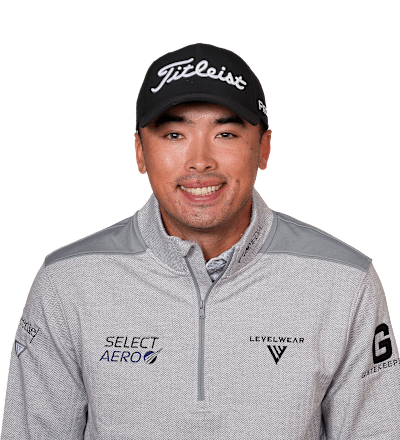
A.J.Ewart
Country

Canada
Age
27Turned Pro
2023Birthplace
Coquitlam, British Columbia, CanadaCollege
Barry UniversityPGA Tour Wins
0Wins (2026)
0Top 10 (2026)
0

World Rank
(OWGR)
206Partners

Canada
A.J. Ewart

A.J. Ewart
Canada
Stat Rankings
| STAT | RANK |
|---|---|
SG: Total Field AVG 0.212 | 85 |
SG: Off The Tee Field AVG -0.275 | 137 |
SG: Approach to Green Field AVG 0.013 | 99 |
SG: Putting Field AVG 0.511 | 11 |
Total Driving Field AVG 226 | 151 |
Driving Distance Field AVG 303.3 | 112 |
Driving Accuracy Field AVG 60.26% | 114 |
GIR % Field AVG 69.28% | 45 |
Proximity Field AVG 35' 9 | 39 |
Approach > 200 yds Field AVG 49' 11 | 80 |
Scrambling Field AVG 63.62% | 25 |
Sand Save % Field AVG 57.14% | 26 |
Scrambling from rough Field AVG 61.49% | 28 |
Putting Avg Field AVG 1.743 | 64 |
Putts Per Round Field AVG 28.70 | 61 |
One-putt % Field AVG 41.16% | 47 |
Scoring Average Field AVG 69.47 | 47 |
Par 4 Field AVG 3.99 | 46 |
Birdie Average Field AVG 4.12 | 36 |
FedExCup Fall Points Field AVG 460 | 106 |
SG: Total
85th
0.212
Field AVGSG: Off The Tee
137th
-0.275
Field AVGSG: Approach to Green
99th
0.013
Field AVGSG: Putting
11th
0.511
Field AVGTotal Driving
151st
226
Field AVGDriving Distance
112th
303.3
Field AVGDriving Accuracy
114th
60.26%
Field AVGGIR %
45th
69.28%
Field AVGProximity
39th
35' 9
Field AVGApproach > 200 yds
80th
49' 11
Field AVGScrambling
25th
63.62%
Field AVGSand Save %
26th
57.14%
Field AVGScrambling from rough
28th
61.49%
Field AVGPutting Avg
64th
1.743
Field AVGPutts Per Round
61st
28.70
Field AVGOne-putt %
47th
41.16%
Field AVGScoring Average
47th
69.47
Field AVGPar 4
46th
3.99
Field AVGBirdie Average
36th
4.12
Field AVGFedExCup Fall Points
106th
460
Field AVG| STAT | VALUE | RANK | SUPPORTING STAT | VALUE |
|---|---|---|---|---|
| SG: Total | 0.212 | 85 | Total SG:T(16.098) | Measured Rounds(76) |
| SG: Tee-to-Green | -0.300 | 131 | SG:OTT(-0.275) | Measured Rounds(76) |
| SG: Off-the-Tee | -0.275 | 137 | Total SG:OTT(-20.891) | Measured Rounds(76) |
| SG: Approach the Green | 0.013 | 99 | Total SG:APP(1.002) | Measured Rounds(76) |
| SG: Around-the-Green | -0.038 | 100 | Total SG:ARG(-2.876) | Measured Rounds(76) |
| SG: Putting | 0.511 | 11 | Total SG:Putting(38.863) | Measured Rounds(76) |
| Longest Drives | 387 | 92 | Tournament(RBC Canadian) | Round(2) |
| Driving Distance | 303.3 | 112 | Total Distance(50,355) | Total Drives(166) |
| Driving Distance - All Drives | 290.8 | 125 | Total Distance(305,871) | # of Drives(1,052) |
| Driving Accuracy Percentage | 60.26% | 114 | Fairways Hit(693) | Possible Fairways(1,150) |
| Left Rough Tendency | 13.24% | 109 | Total Left rough(138) | Possible Fwys(1,042) |
| Right Rough Tendency | 14.20% | 107 | Total Right rough(148) | Possible Fwys(1,042) |
| Distance from Edge of Fairway | 30' 4 | 136 | Total Distance (Feet)(12,159.500) | Total Strokes(401) |
| Club Head Speed | 116.52 | 97 | Total Club Head Speed(32,276.48) | Total Attempts(277) |
| Total Driving Efficiency | 218 | 111 | Carry Efficiency Rank(103) | |
| Greens in Regulation Percentage | 69.28% | 45 | Greens Hit(1,035) | # Holes(1,494) |
| Proximity to Hole | 35' 9 | 39 | Total Distance (feet)(48,362.917) | # of Attempts(1,354) |
| Approaches from > 275 yards | 86' 4 | 117 | Total Distance (feet)(1,812.417) | # of Attempts(21) |
| Approaches from 250-275 yards | 67' 1 | 138 | Total Distance (feet)(1,542.500) | # of Attempts(23) |
| Approaches from 225-250 yards | 51' 6 | 116 | Total Distance (feet)(3,450.417) | # of Attempts(67) |
| Approaches from 200-225 yards | 39' 11 | 67 | Total Distance (feet)(5,070.167) | # of Attempts(127) |
| Approaches from > 200 yards | 49' 11 | 80 | Total Distance (feet)(11,875.500) | # of Attempts(238) |
| Approaches from 175-200 yards | 32' 4 | 47 | Total Distance (feet)(6,858.333) | # of Attempts(212) |
| Approaches from 150-175 yards | 27' 1 | 48 | Total Distance (feet)(5,196.083) | # of Attempts(192) |
| Approaches from 125-150 yards | 24' 7 | 125 | Total Distance (feet)(3,690.083) | # of Attempts(150) |
| Approaches from 50-125 yards | 17' 10 | 35 | Total Distance (feet)(3,546.250) | # of Attempts(199) |
| Approaches from 100-125 yards | 18' 1 | 25 | Total Distance (feet)(1,915.500) | # of Attempts(106) |
| Approaches from 75-100 yards | 17' 4 | 78 | Total Distance (feet)(1,141.500) | # of Attempts(66) |
| Approaches from 50-75 yards | 18' 1 | 104 | Total Distance (feet)(489.250) | # of Attempts(27) |
| Approaches from inside 100 yards | 17' 5 | 93 | Total Distance (feet)(1,633.750) | # of Attempts(94) |
| Approaches from > 100 yards | 32' 11 | 64 | Total Distance (feet)(29,535.500) | # of Attempts(898) |
| Fairway Proximity | 31' 5 | 59 | Attempts(992) | |
| Rough Proximity | 43' 7 | 22 | Total Distance (inches)(134,853) | Attempts(258) |
| Left Rough Proximity | 42' 10 | 29 | Attempts(128) | |
| Right Rough Proximity | 44' 3 | 31 | Attempts(130) | |
| Approaches from > 275 yards (Rgh) | 123' 1 | 142 | Total Distance (feet)(615.583) | # of Attempts(5) |
| Approaches from 250-275 yards (Rgh) | 90' 5 | 119 | Total Distance (feet)(1,085.417) | # of Attempts(12) |
| Approaches from 225-250 yards (Rgh) | 67' 7 | 62 | Total Distance (feet)(879.000) | # of Attempts(13) |
| Approaches from 200-225 yards (Rgh) | 53' 10 | 13 | Total Distance (feet)(700.083) | # of Attempts(13) |
| Approaches from > 100 yards (Rgh) | 46' 11 | 31 | Total Distance (feet)(10,365.417) | # of Attempts(221) |
| Approaches from inside 100 yards (Rgh) | 23' 7 | 44 | Total Distance (feet)(872.333) | # of Attempts(37) |
| Approaches from > 200 yards (Rgh) | 76' 3 | 111 | Total Distance (feet)(3,280.083) | # of Attempts(43) |
| Approaches from 175-200 yards (Rgh) | 49' 8 | 38 | Total Distance (feet)(1,737.750) | # of Attempts(35) |
| Approaches from 150-175 yards (Rgh) | 46' 0 | 88 | Total Distance (feet)(2,392.917) | # of Attempts(52) |
| Approaches from 125-150 yards (Rgh) | 34' 4 | 33 | Total Distance (feet)(1,889.833) | # of Attempts(55) |
| Approaches from 50-125 yards (Rgh) | 27' 10 | 47 | Total Distance (feet)(1,864.333) | # of Attempts(67) |
| Approaches from 100-125 yards (Rgh) | 29' 7 | 52 | Total Distance (feet)(1,064.833) | # of Attempts(36) |
| Approaches from 75-100 yards (Rgh) | 29' 4 | 97 | Total Distance (feet)(587.083) | # of Attempts(20) |
| Approaches from 50-75 yards (Rgh) | 19' 4 | 46 | Total Distance (feet)(212.417) | # of Attempts(11) |
| Going for the Green | 53.21% | 155 | Attempts(149) | Non-Attempts(131) |
| Going for the Green - Hit Green Pct. | 24.83% | 91 | Successes(37) | Attempts(149) |
| Going for the Green - Birdie or Better | 64.43% | 51 | # of Birdie or Better(96) | Attempts(149) |
| Total Hole Outs | 14 | 84 | ||
| Longest Hole Outs (in yards) | 197 | 13 | Tournament(Charles Schwab) | Round- Course(2) |
| Scrambling | 63.62% | 25 | Par or Better(292) | Missed GIR(459) |
| Scrambling from the Rough | 61.49% | 28 | Successes(107) | Attempts(174) |
| Scrambling from the Fringe | - | - | ||
| Scrambling from > 30 yards | 37.00% | 26 | Successes(37) | Attempts(100) |
| Scrambling from 20-30 yards | 66.10% | 2 | Successes(39) | Attempts(59) |
| Scrambling from 10-20 yards | 70.06% | 48 | Successes(124) | Attempts(177) |
| Scrambling from < 10 yards | 87.21% | 104 | Successes(75) | Attempts(86) |
| Sand Save Percentage | 57.14% | 26 | # Saves(52) | # Bunkers(91) |
| Proximity to Hole from Sand | 9' 0 | 48 | Total Distance (feet)(573.750) | # of Shots(64) |
| Total Putting | 80.4 | 14 | ||
| Putting Average | 1.743 | 64 | GIR Putts(1,804) | Greens Hit(1,035) |
| Overall Putting Average | 1.594 | 61 | # of Putts(2,382) | # of Holes(1,494) |
| Birdie or Better Conversion Percentage | 32.30% | 69 | # Birdies(334) | Greens Hit(1,034) |
| Putts Per Round | 28.70 | 61 | Total Putts(2,382) | Total Rounds(83) |
| Putts per Round - Round 1 | 29.24 | 108 | Total Putts(731) | Total Rounds(25) |
| Putts per Round - Round 2 | 28.20 | 21 | Total Putts(705) | Total Rounds(25) |
| Putts per Round - Round 3 | 28.59 | 71 | Total Putts(486) | Total Rounds(17) |
| Putts per Round - Round 4 | 28.75 | 78 | Total Putts(460) | Total Rounds(16) |
| One-Putt Percentage | 41.16% | 47 | # of 1 putts(615) | # of holes(1,494) |
| Longest Putts | 46' 1 | 184 | Year/Tourn#(Texas Children's) | Round(2) |
| 3-Putt Avoidance | 2.48% | 79 | Total 3 Putts(37) | Total Holes (overall)(1,494) |
| Putting from - > 25' | 6.20% | 50 | Attempts(371) | Putts made(23) |
| Putting from - 20-25' | 15.32% | 47 | Attempts(111) | Putts made(17) |
| Putting from - 15-20' | 25.00% | 24 | Attempts(156) | Putts made(39) |
| Putting from - 10-15' | 34.17% | 58 | Attempts(199) | Putts made(68) |
| Putting - Inside 10' | 90.36% | 5 | Attempts(1,338) | Putts made(1,209) |
| Putting from 10' | 60.78% | 3 | Attempts(51) | |
| Putting from 9' | 58.18% | 22 | Attempts(55) | |
| Putting from 8' | 61.67% | 26 | Attempts(60) | |
| Putting from 7' | 76.56% | 3 | Attempts(64) | |
| Putting from 6' | 74.03% | 47 | Attempts(77) | |
| Putting from 5' | 79.27% | 134 | Attempts(82) | |
| Putting from 4-8' | 73.50% | 23 | Attempts(283) | Putts made(208) |
| Putting from 4' | 94.67% | 40 | Attempts(150) | |
| Putting from 3' | 99.62% | 67 | Attempts(799) | |
| Average Distance of Putts made | 79' 7 | 9 | Total Dist. (inches)(72,584) | Total Rounds(76) |
| Approach Putt Performance | 2' 1 | 39 | Attempts(786) | |
| Scoring Average (Adjusted) | 70.748 | 89 | Total Strokes(5,766) | Total Adjustment(106.107) |
| Scoring Average (Actual) | 69.47 | 47 | Total Strokes(5,766) | Total Rounds(83) |
| Lowest Round | 63 | 51 | Tourn/Course(Charles Schwab/) | Round(2) |
| Birdie Average | 4.12 | 36 | # of Birdies(342) | Total Rounds(83) |
| Total Birdies | 342 | 37 | ||
| Eagles (Holes per) | 498.0 | 163 | # of Holes(1,494) | # of Eagles(3) |
| Total Eagles | 3 | 158 | ||
| Par Breakers | 23.09% | 50 | # Birdies/Eagles(345) | # Holes(1,494) |
| Bounce Back | 24.46% | 55 | ||
| Par 3 Birdie or Better Leaders | 13.37% | 95 | Par 3 Birdies or Better(46) | Par 3 Holes(344) |
| Par 4 Birdie or Better Leaders | 18.08% | 90 | Par 4 Birdies or Better(160) | Par 4 Holes(885) |
| Par 5 Birdie or Better Leaders | 52.45% | 39 | Par 5 Birdies or Better(139) | Par 5 Holes(265) |
| Birdie or Better Percentage | 23.09% | 50 | Total Birdies(345) | Total Holes(1,494) |
| Bogey Avoidance | 13.05% | 18 | Bogeys(195) | Holes Played(1,494) |
| Final Round Scoring Average | 69.18 | 44 | Total Strokes(1,176) | Total Rounds(17) |
| Final Round Performance | 44.44% | 122 | ||
| Round 1 Scoring Average | 70.20 | 111 | Total Strokes(1,755) | Total Rounds(25) |
| Round 2 Scoring Average | 68.80 | 19 | Total Strokes(1,720) | Total Rounds(25) |
| Round 3 Scoring Average | 69.65 | 77 | Total Strokes(1,184) | Total Rounds(17) |
| Round 4 Scoring Average | 69.19 | 45 | Total Strokes(1,107) | Total Rounds(16) |
| Par 3 Scoring Average | 3.01 | 30 | Total Strokes(1,036) | Total Holes(344) |
| Par 4 Scoring Average | 3.99 | 46 | Total Strokes(3,527) | Total Holes(885) |
| Par 5 Scoring Average | 4.54 | 55 | Total Strokes(1,203) | Total Holes(265) |
| Front 9 Scoring Average | 34.66 | 68 | Total Strokes(2,877) | Total Holes(83) |
| Back 9 Scoring Average | 34.81 | 37 | Total Strokes(2,889) | Total Holes(83) |
| Early Scoring Average | 69.09 | 37 | Total Strokes(3,040) | Total Early Rounds(44) |
| Late Scoring Average | 69.90 | 74 | Total Strokes(2,726) | Total Late Rounds(39) |
| Consecutive Cuts | - | - | ||
| Current Streak without a 3-Putt | 22 | 269 | ||
| Consecutive Fairways Hit | 15 | 156 | Current Streak(0) | |
| Consecutive GIR | 16 | 125 | Current Streak(0) | Round(1) |
| Consecutive Sand Saves | 5 | 132 | Current Streak(0) | Round(4) |
| Best YTD 1-Putt or Better Streak | 9 | 27 | ||
| Best YTD Streak w/o a 3-Putt | 169 | 71 | Current Streak(22) | |
| YTD Par or Better Streak | 12 | 84 | ||
| Consecutive Par 3 Birdies | 3 | 21 | ||
| Consecutive Holes Below Par | 5 | 28 | ||
| Consecutive Birdies Streak | 5 | 26 | ||
| Consecutive Birdies/Eagles streak | 1 | 210 | ||
| Official Money | $1,207,901 | 113 | YTD Victories | |
| FedExCup Fall Points | 460 | 106 |