



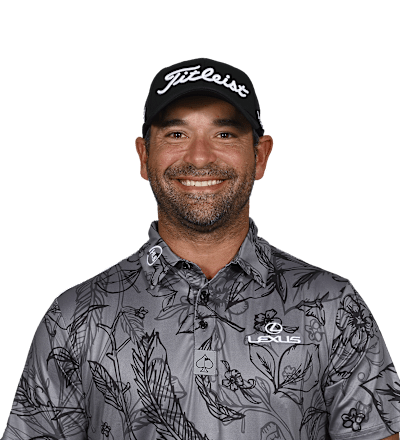
RafaelCampos
País

Puerto Rico
Edad
38Profesional desde
2011Lugar de nacimiento
San Juan, PRUniversidad
Virginia Commonwealth UniversityPGA Tour Wins
1
Wins (2026)
0Top 10 (2026)
0

World Rank
(OWGR)
643Partners

Puerto Rico
Rafael Campos

Rafael Campos
Puerto Rico
Clasificaciones de estadísticas
| STAT | RANK |
|---|---|
SG: Total Promedio del Field -1.184 | 157 |
SG: Off The Tee Promedio del Field -0.219 | 131 |
SG: Approach to Green Promedio del Field -0.101 | 112 |
SG: Putting Promedio del Field -0.422 | 156 |
Total Driving Promedio del Field 205 | 135 |
Driving Distance Promedio del Field 306.5 | 83 |
Driving Accuracy Promedio del Field 58.56% | 122 |
GIR % Promedio del Field 67.19% | 79 |
Proximity Promedio del Field 36' 6 | 80 |
Approach > 200 yds Promedio del Field 49' 7 | 78 |
Scrambling Promedio del Field 57.51% | 123 |
Sand Save % Promedio del Field 46.58% | 127 |
Scrambling from rough Promedio del Field 55.46% | 99 |
Putting Avg Promedio del Field 1.799 | 161 |
Putts Per Round Promedio del Field 29.60 | 152 |
One-putt % Promedio del Field 37.32% | 140 |
Scoring Average Promedio del Field 70.64 | 148 |
Par 4 Promedio del Field 4.04 | 133 |
Birdie Average Promedio del Field 3.49 | 153 |
FedExCup Fall Points Promedio del Field 113 | 168 |
SG: Total
157º
-1.184
Promedio del FieldSG: Off The Tee
131º
-0.219
Promedio del FieldSG: Approach to Green
112º
-0.101
Promedio del FieldSG: Putting
156º
-0.422
Promedio del FieldTotal Driving
135º
205
Promedio del FieldDriving Distance
83º
306.5
Promedio del FieldDriving Accuracy
122º
58.56%
Promedio del FieldGIR %
79º
67.19%
Promedio del FieldProximity
80º
36' 6
Promedio del FieldApproach > 200 yds
78º
49' 7
Promedio del FieldScrambling
123º
57.51%
Promedio del FieldSand Save %
127º
46.58%
Promedio del FieldScrambling from rough
99º
55.46%
Promedio del FieldPutting Avg
161º
1.799
Promedio del FieldPutts Per Round
152º
29.60
Promedio del FieldOne-putt %
140º
37.32%
Promedio del FieldScoring Average
148º
70.64
Promedio del FieldPar 4
133º
4.04
Promedio del FieldBirdie Average
153º
3.49
Promedio del FieldFedExCup Fall Points
168º
113
Promedio del Field| STAT | VALUE | RANK | SUPPORTING STAT | VALUE |
|---|---|---|---|---|
| SG: Total | -1.184 | 157 | Total SG:T(-54.458) | Measured Rounds(46) |
| SG: Tee-to-Green | -0.762 | 153 | SG:OTT(-0.219) | Measured Rounds(46) |
| SG: Off-the-Tee | -0.219 | 131 | Total SG:OTT(-10.053) | Measured Rounds(46) |
| SG: Approach the Green | -0.101 | 112 | Total SG:APP(-4.642) | Measured Rounds(46) |
| SG: Around-the-Green | -0.442 | 159 | Total SG:ARG(-20.340) | Measured Rounds(46) |
| SG: Putting | -0.422 | 156 | Total SG:Putting(-19.424) | Measured Rounds(46) |
| Longest Drives | 375 | 184 | Tournament(Bank of Utah) | Round(1) |
| Driving Distance | 306.5 | 83 | Total Distance(32,486) | Total Drives(106) |
| Driving Distance - All Drives | 291.5 | 118 | Total Distance(185,946) | # of Drives(638) |
| Driving Accuracy Percentage | 58.56% | 122 | Fairways Hit(431) | Possible Fairways(736) |
| Left Rough Tendency | 15.12% | 134 | Total Left rough(96) | Possible Fwys(635) |
| Right Rough Tendency | 12.91% | 53 | Total Right rough(82) | Possible Fwys(635) |
| Distance from Edge of Fairway | 29' 7 | 123 | Total Distance (Feet)(7,427.000) | Total Strokes(251) |
| Club Head Speed | 117.26 | 83 | Total Club Head Speed(21,107.44) | Total Attempts(180) |
| Total Driving Efficiency | 235 | 118 | Carry Efficiency Rank(136) | |
| Greens in Regulation Percentage | 67.19% | 79 | Greens Hit(641) | # Holes(954) |
| Proximity to Hole | 36' 6 | 80 | Total Distance (feet)(30,074.750) | # of Attempts(824) |
| Approaches from > 275 yards | 88' 7 | 129 | Total Distance (feet)(974.000) | # of Attempts(11) |
| Approaches from 250-275 yards | 73' 4 | 157 | Total Distance (feet)(1,100.083) | # of Attempts(15) |
| Approaches from 225-250 yards | 47' 11 | 62 | Total Distance (feet)(2,252.917) | # of Attempts(47) |
| Approaches from 200-225 yards | 40' 1 | 65 | Total Distance (feet)(2,965.917) | # of Attempts(74) |
| Approaches from > 200 yards | 49' 7 | 78 | Total Distance (feet)(7,292.917) | # of Attempts(147) |
| Approaches from 175-200 yards | 37' 0 | 155 | Total Distance (feet)(3,806.917) | # of Attempts(103) |
| Approaches from 150-175 yards | 24' 11 | 4 | Total Distance (feet)(2,968.583) | # of Attempts(119) |
| Approaches from 125-150 yards | 27' 6 | 158 | Total Distance (feet)(2,863.833) | # of Attempts(104) |
| Approaches from 50-125 yards | 19' 2 | 98 | Total Distance (feet)(2,379.750) | # of Attempts(124) |
| Approaches from 100-125 yards | 20' 6 | 111 | Total Distance (feet)(1,660.250) | # of Attempts(81) |
| Approaches from 75-100 yards | 18' 0 | 99 | Total Distance (feet)(631.333) | # of Attempts(35) |
| Approaches from 50-75 yards | 11' 0 | 7 | Total Distance (feet)(88.167) | # of Attempts(8) |
| Approaches from inside 100 yards | 16' 8 | 64 | Total Distance (feet)(783.750) | # of Attempts(47) |
| Approaches from > 100 yards | 33' 7 | 106 | Total Distance (feet)(18,592.500) | # of Attempts(554) |
| Fairway Proximity | 32' 3 | 105 | Attempts(601) | |
| Rough Proximity | 45' 8 | 64 | Total Distance (inches)(86,094) | Attempts(157) |
| Left Rough Proximity | 46' 5 | 101 | Attempts(79) | |
| Right Rough Proximity | 45' 0 | 48 | Attempts(78) | |
| Approaches from > 275 yards (Rgh) | 105' 1 | 104 | Total Distance (feet)(105.083) | # of Attempts(1) |
| Approaches from 250-275 yards (Rgh) | 87' 2 | 101 | Total Distance (feet)(348.667) | # of Attempts(4) |
| Approaches from 225-250 yards (Rgh) | 66' 7 | 54 | Total Distance (feet)(333.083) | # of Attempts(5) |
| Approaches from 200-225 yards (Rgh) | 72' 9 | 126 | Total Distance (feet)(1,381.583) | # of Attempts(19) |
| Approaches from > 100 yards (Rgh) | 47' 6 | 40 | Total Distance (feet)(6,649.917) | # of Attempts(140) |
| Approaches from inside 100 yards (Rgh) | 30' 10 | 135 | Total Distance (feet)(524.583) | # of Attempts(17) |
| Approaches from > 200 yards (Rgh) | 74' 9 | 89 | Total Distance (feet)(2,168.417) | # of Attempts(29) |
| Approaches from 175-200 yards (Rgh) | 53' 1 | 76 | Total Distance (feet)(1,379.583) | # of Attempts(26) |
| Approaches from 150-175 yards (Rgh) | 39' 5 | 6 | Total Distance (feet)(1,616.667) | # of Attempts(41) |
| Approaches from 125-150 yards (Rgh) | 34' 3 | 31 | Total Distance (feet)(1,061.667) | # of Attempts(31) |
| Approaches from 50-125 yards (Rgh) | 32' 8 | 133 | Total Distance (feet)(947.583) | # of Attempts(29) |
| Approaches from 100-125 yards (Rgh) | 32' 7 | 98 | Total Distance (feet)(423.583) | # of Attempts(13) |
| Approaches from 75-100 yards (Rgh) | 30' 8 | 115 | Total Distance (feet)(245.583) | # of Attempts(8) |
| Approaches from 50-75 yards (Rgh) | 34' 10 | 152 | Total Distance (feet)(278.417) | # of Attempts(8) |
| Going for the Green | 60.13% | 107 | Attempts(95) | Non-Attempts(63) |
| Going for the Green - Hit Green Pct. | 23.16% | 106 | Successes(22) | Attempts(95) |
| Going for the Green - Birdie or Better | 46.32% | 162 | # of Birdie or Better(44) | Attempts(95) |
| Total Hole Outs | 6 | 157 | ||
| Longest Hole Outs (in yards) | 20 | 201 | Tournament(Bank of Utah) | Round- Course(2) |
| Scrambling | 57.51% | 123 | Par or Better(180) | Missed GIR(313) |
| Scrambling from the Rough | 55.46% | 99 | Successes(66) | Attempts(119) |
| Scrambling from the Fringe | - | - | ||
| Scrambling from > 30 yards | 31.03% | 71 | Successes(18) | Attempts(58) |
| Scrambling from 20-30 yards | 52.17% | 105 | Successes(24) | Attempts(46) |
| Scrambling from 10-20 yards | 55.34% | 162 | Successes(57) | Attempts(103) |
| Scrambling from < 10 yards | 86.67% | 107 | Successes(52) | Attempts(60) |
| Sand Save Percentage | 46.58% | 127 | # Saves(34) | # Bunkers(73) |
| Proximity to Hole from Sand | 9' 2 | 62 | Total Distance (feet)(484.500) | # of Shots(53) |
| Total Putting | 271.8 | 154 | ||
| Putting Average | 1.799 | 161 | GIR Putts(1,153) | Greens Hit(641) |
| Overall Putting Average | 1.645 | 152 | # of Putts(1,569) | # of Holes(954) |
| Birdie or Better Conversion Percentage | 28.44% | 153 | # Birdies(182) | Greens Hit(640) |
| Putts Per Round | 29.60 | 152 | Total Putts(1,569) | Total Rounds(53) |
| Putts per Round - Round 1 | 29.86 | 148 | Total Putts(627) | Total Rounds(21) |
| Putts per Round - Round 2 | 29.48 | 131 | Total Putts(619) | Total Rounds(21) |
| Putts per Round - Round 3 | 29.17 | 114 | Total Putts(175) | Total Rounds(6) |
| Putts per Round - Round 4 | 29.60 | 131 | Total Putts(148) | Total Rounds(5) |
| One-Putt Percentage | 37.32% | 140 | # of 1 putts(356) | # of holes(954) |
| Longest Putts | 44' 4 | 203 | Year/Tourn#(3M Open) | Round(1) |
| 3-Putt Avoidance | 3.04% | 133 | Total 3 Putts(29) | Total Holes (overall)(954) |
| Putting from - > 25' | 5.22% | 93 | Attempts(230) | Putts made(12) |
| Putting from - 20-25' | 8.45% | 140 | Attempts(71) | Putts made(6) |
| Putting from - 15-20' | 16.16% | 139 | Attempts(99) | Putts made(16) |
| Putting from - 10-15' | 31.62% | 88 | Attempts(117) | Putts made(37) |
| Putting - Inside 10' | 87.97% | 102 | Attempts(856) | Putts made(753) |
| Putting from 10' | 31.82% | 152 | Attempts(22) | |
| Putting from 9' | 44.12% | 108 | Attempts(34) | |
| Putting from 8' | 54.29% | 85 | Attempts(35) | |
| Putting from 7' | 67.65% | 30 | Attempts(34) | |
| Putting from 6' | 62.50% | 148 | Attempts(48) | |
| Putting from 5' | 77.78% | 139 | Attempts(63) | |
| Putting from 4-8' | 67.22% | 125 | Attempts(180) | Putts made(121) |
| Putting from 4' | 92.55% | 99 | Attempts(94) | |
| Putting from 3' | 99.43% | 104 | Attempts(526) | |
| Average Distance of Putts made | 68' 5 | 127 | Total Dist. (inches)(37,759) | Total Rounds(46) |
| Approach Putt Performance | 2' 1 | 29 | Attempts(522) | |
| Scoring Average (Adjusted) | 71.892 | 153 | Total Strokes(3,744) | Total Adjustment(66.259) |
| Scoring Average (Actual) | 70.64 | 148 | Total Strokes(3,744) | Total Rounds(53) |
| Lowest Round | 65 | 170 | Tourn/Course(Butterfield Ber) | Round(2) |
| Birdie Average | 3.49 | 153 | # of Birdies(185) | Total Rounds(53) |
| Total Birdies | 185 | 155 | ||
| Eagles (Holes per) | 318.0 | 151 | # of Holes(954) | # of Eagles(3) |
| Total Eagles | 3 | 151 | ||
| Par Breakers | 19.71% | 156 | # Birdies/Eagles(188) | # Holes(954) |
| Bounce Back | 25.00% | 37 | ||
| Par 3 Birdie or Better Leaders | 12.39% | 118 | Par 3 Birdies or Better(27) | Par 3 Holes(218) |
| Par 4 Birdie or Better Leaders | 15.88% | 147 | Par 4 Birdies or Better(91) | Par 4 Holes(573) |
| Par 5 Birdie or Better Leaders | 42.94% | 152 | Par 5 Birdies or Better(70) | Par 5 Holes(163) |
| Birdie or Better Percentage | 19.71% | 156 | Total Birdies(188) | Total Holes(954) |
| Bogey Avoidance | 16.56% | 127 | Bogeys(158) | Holes Played(954) |
| Final Round Scoring Average | 69.33 | 55 | Total Strokes(416) | Total Rounds(6) |
| Final Round Performance | 50.00% | 89 | ||
| Round 1 Scoring Average | 70.71 | 137 | Total Strokes(1,485) | Total Rounds(21) |
| Round 2 Scoring Average | 71.24 | 153 | Total Strokes(1,496) | Total Rounds(21) |
| Round 3 Scoring Average | 69.83 | 94 | Total Strokes(419) | Total Rounds(6) |
| Round 4 Scoring Average | 68.80 | 16 | Total Strokes(344) | Total Rounds(5) |
| Par 3 Scoring Average | 3.10 | 139 | Total Strokes(675) | Total Holes(218) |
| Par 4 Scoring Average | 4.04 | 133 | Total Strokes(2,315) | Total Holes(573) |
| Par 5 Scoring Average | 4.63 | 139 | Total Strokes(754) | Total Holes(163) |
| Front 9 Scoring Average | 35.28 | 144 | Total Strokes(1,870) | Total Holes(53) |
| Back 9 Scoring Average | 35.36 | 133 | Total Strokes(1,874) | Total Holes(53) |
| Early Scoring Average | 70.86 | 150 | Total Strokes(1,984) | Total Early Rounds(28) |
| Late Scoring Average | 70.40 | 120 | Total Strokes(1,760) | Total Late Rounds(25) |
| Consecutive Cuts | - | - | ||
| Current Streak without a 3-Putt | 75 | 48 | ||
| Consecutive Fairways Hit | 17 | 98 | Current Streak(1) | |
| Consecutive GIR | 20 | 42 | Current Streak(0) | Round(2) |
| Consecutive Sand Saves | 6 | 81 | Current Streak(0) | Round(2) |
| Best YTD 1-Putt or Better Streak | 7 | 99 | ||
| Best YTD Streak w/o a 3-Putt | 79 | 229 | Current Streak(75) | |
| YTD Par or Better Streak | 5 | 218 | ||
| Consecutive Par 3 Birdies | 3 | 20 | ||
| Consecutive Holes Below Par | 4 | 76 | ||
| Consecutive Birdies Streak | 4 | 66 | ||
| Consecutive Birdies/Eagles streak | 1 | 198 | ||
| Official Money | $257,674 | 177 | YTD Victories | |
| FedExCup Fall Points | 113 | 168 |