



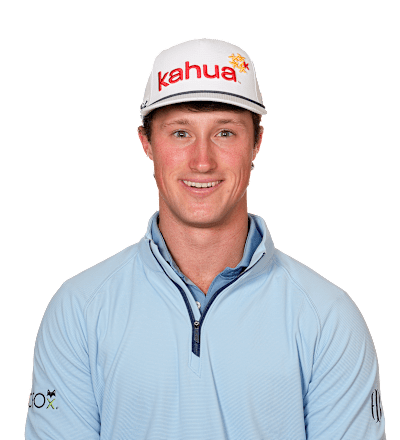
DavidFord
País

United States
Era
24Tornou-se profissional
2025Local de nascimento
-Faculdade
University of North Carolina-Chapel HillPGA Tour Wins
0Wins (2026)
0Top 10 (2026)
2


World Rank
(OWGR)
177Partners

United States
David Ford

David Ford
United States
Classificações de estatísticas
| STAT | RANK |
|---|---|
SG: Total 0.670 | - |
SG: Off The Tee 0.649 | - |
| - | |
SG: Putting 0.150 | - |
Total Driving 1,998 | - |
Driving Distance 306.1 | - |
Driving Accuracy 69.52% | - |
GIR % 68.52% | - |
Proximity 37' 0 | - |
Approach > 200 yds 51' 6 | - |
Scrambling 66.27% | - |
Sand Save % 48.44% | - |
Scrambling from rough 58.06% | - |
Putting Avg 1.762 | - |
Putts Per Round 28.80 | - |
One-putt % 39.26% | - |
Scoring Average 69.29 | - |
Par 4 3.94 | - |
Birdie Average 4.09 | - |
FedExCup Fall Points AVG de Campo 430 | 112 |
SG: Total
-
0.670
AVG de CampoSG: Off The Tee
-
0.649
AVG de CampoSG: Approach to Green
-
0.230
AVG de CampoSG: Putting
-
0.150
AVG de CampoTotal Driving
-
1,998
AVG de CampoDriving Distance
-
306.1
AVG de CampoDriving Accuracy
-
69.52%
AVG de CampoGIR %
-
68.52%
AVG de CampoProximity
-
37' 0
AVG de CampoApproach > 200 yds
-
51' 6
AVG de CampoScrambling
-
66.27%
AVG de CampoSand Save %
-
48.44%
AVG de CampoScrambling from rough
-
58.06%
AVG de CampoPutting Avg
-
1.762
AVG de CampoPutts Per Round
-
28.80
AVG de CampoOne-putt %
-
39.26%
AVG de CampoScoring Average
-
69.29
AVG de CampoPar 4
-
3.94
AVG de CampoBirdie Average
-
4.09
AVG de CampoFedExCup Fall Points
112º
430
AVG de Campo| STAT | VALUE | RANK | SUPPORTING STAT | VALUE |
|---|---|---|---|---|
| SG: Total | 0.670 | - | Total SG:T(25.474) | Measured Rounds(38) |
| SG: Tee-to-Green | 0.521 | - | SG:OTT(0.649) | Measured Rounds(38) |
| SG: Off-the-Tee | 0.649 | - | Total SG:OTT(24.674) | Measured Rounds(38) |
| SG: Approach the Green | 0.230 | - | Total SG:APP(8.753) | Measured Rounds(38) |
| SG: Around-the-Green | -0.359 | - | Total SG:ARG(-13.632) | Measured Rounds(38) |
| SG: Putting | 0.150 | - | Total SG:Putting(5.681) | Measured Rounds(38) |
| Longest Drives | 383 | 119 | Tournament(World Wide Technology) | Round(3) |
| Driving Distance | 306.1 | - | Total Distance(27,552) | Total Drives(90) |
| Driving Distance - All Drives | 294.2 | - | Total Distance(153,560) | # of Drives(522) |
| Driving Accuracy Percentage | 69.52% | - | Fairways Hit(431) | Possible Fairways(620) |
| Left Rough Tendency | 10.34% | - | Total Left rough(54) | Possible Fwys(522) |
| Right Rough Tendency | 10.73% | - | Total Right rough(56) | Possible Fwys(522) |
| Distance from Edge of Fairway | 22' 3 | - | Total Distance (Feet)(3,229.417) | Total Strokes(145) |
| Club Head Speed | 117.08 | - | Total Club Head Speed(17,093.42) | Total Attempts(146) |
| Total Driving Efficiency | 1,998 | - | Carry Efficiency Rank(999) | |
| Greens in Regulation Percentage | 68.52% | - | Greens Hit(555) | # Holes(810) |
| Proximity to Hole | 37' 0 | - | Total Distance (feet)(25,171.000) | # of Attempts(681) |
| Approaches from > 275 yards | 83' 10 | - | Total Distance (feet)(1,425.167) | # of Attempts(17) |
| Approaches from 250-275 yards | 56' 3 | - | Total Distance (feet)(1,294.583) | # of Attempts(23) |
| Approaches from 225-250 yards | 51' 5 | - | Total Distance (feet)(1,541.833) | # of Attempts(30) |
| Approaches from 200-225 yards | 41' 11 | - | Total Distance (feet)(2,849.750) | # of Attempts(68) |
| Approaches from > 200 yards | 51' 6 | - | Total Distance (feet)(7,111.333) | # of Attempts(138) |
| Approaches from 175-200 yards | 34' 1 | - | Total Distance (feet)(3,847.667) | # of Attempts(113) |
| Approaches from 150-175 yards | 26' 5 | - | Total Distance (feet)(2,694.667) | # of Attempts(102) |
| Approaches from 125-150 yards | 23' 4 | - | Total Distance (feet)(1,864.333) | # of Attempts(80) |
| Approaches from 50-125 yards | 24' 4 | - | Total Distance (feet)(2,412.000) | # of Attempts(99) |
| Approaches from 100-125 yards | 23' 6 | - | Total Distance (feet)(1,528.500) | # of Attempts(65) |
| Approaches from 75-100 yards | 27' 5 | - | Total Distance (feet)(631.167) | # of Attempts(23) |
| Approaches from 50-75 yards | 22' 11 | - | Total Distance (feet)(252.333) | # of Attempts(11) |
| Approaches from inside 100 yards | 25' 3 | - | Total Distance (feet)(907.917) | # of Attempts(36) |
| Approaches from > 100 yards | 34' 3 | - | Total Distance (feet)(17,046.500) | # of Attempts(498) |
| Fairway Proximity | 33' 7 | - | Attempts(534) | |
| Rough Proximity | 45' 10 | - | Total Distance (inches)(55,563) | Attempts(101) |
| Left Rough Proximity | 48' 7 | - | Attempts(46) | |
| Right Rough Proximity | 43' 7 | - | Attempts(55) | |
| Approaches from > 275 yards (Rgh) | 73' 7 | - | Total Distance (feet)(147.083) | # of Attempts(2) |
| Approaches from 250-275 yards (Rgh) | 87' 1 | - | Total Distance (feet)(609.667) | # of Attempts(7) |
| Approaches from 225-250 yards (Rgh) | 72' 3 | - | Total Distance (feet)(361.083) | # of Attempts(5) |
| Approaches from 200-225 yards (Rgh) | 70' 10 | - | Total Distance (feet)(425.000) | # of Attempts(6) |
| Approaches from > 100 yards (Rgh) | 47' 9 | - | Total Distance (feet)(4,491.417) | # of Attempts(94) |
| Approaches from inside 100 yards (Rgh) | 19' 10 | - | Total Distance (feet)(138.833) | # of Attempts(7) |
| Approaches from > 200 yards (Rgh) | 77' 2 | - | Total Distance (feet)(1,542.833) | # of Attempts(20) |
| Approaches from 175-200 yards (Rgh) | 47' 5 | - | Total Distance (feet)(616.417) | # of Attempts(13) |
| Approaches from 150-175 yards (Rgh) | 44' 11 | - | Total Distance (feet)(1,436.500) | # of Attempts(32) |
| Approaches from 125-150 yards (Rgh) | 36' 6 | - | Total Distance (feet)(438.083) | # of Attempts(12) |
| Approaches from 50-125 yards (Rgh) | 25' 6 | - | Total Distance (feet)(587.083) | # of Attempts(23) |
| Approaches from 100-125 yards (Rgh) | 26' 11 | - | Total Distance (feet)(457.583) | # of Attempts(17) |
| Approaches from 75-100 yards (Rgh) | 14' 5 | - | Total Distance (feet)(43.333) | # of Attempts(3) |
| Approaches from 50-75 yards (Rgh) | 28' 9 | - | Total Distance (feet)(86.167) | # of Attempts(3) |
| Going for the Green | 73.03% | - | Attempts(111) | Non-Attempts(41) |
| Going for the Green - Hit Green Pct. | 36.28% | - | Successes(41) | Attempts(113) |
| Going for the Green - Birdie or Better | 57.52% | - | # of Birdie or Better(65) | Attempts(113) |
| Total Hole Outs | 14 | - | ||
| Longest Hole Outs (in yards) | 144 | 48 | Tournament(Cognizant Classic) | Round- Course(1) |
| Scrambling | 66.27% | - | Par or Better(169) | Missed GIR(255) |
| Scrambling from the Rough | 58.06% | - | Successes(54) | Attempts(93) |
| Scrambling from the Fringe | - | - | ||
| Scrambling from > 30 yards | 25.00% | - | Successes(7) | Attempts(28) |
| Scrambling from 20-30 yards | 45.71% | - | Successes(16) | Attempts(35) |
| Scrambling from 10-20 yards | 73.28% | - | Successes(85) | Attempts(116) |
| Scrambling from < 10 yards | 91.30% | - | Successes(42) | Attempts(46) |
| Sand Save Percentage | 48.44% | - | # Saves(31) | # Bunkers(64) |
| Proximity to Hole from Sand | 9' 6 | - | Total Distance (feet)(416.167) | # of Shots(44) |
| Total Putting | - | - | ||
| Putting Average | 1.762 | - | GIR Putts(978) | Greens Hit(555) |
| Overall Putting Average | 1.600 | - | # of Putts(1,296) | # of Holes(810) |
| Birdie or Better Conversion Percentage | 33.03% | - | # Birdies(182) | Greens Hit(551) |
| Putts Per Round | 28.80 | - | Total Putts(1,296) | Total Rounds(45) |
| Putts per Round - Round 1 | 28.93 | - | Total Putts(405) | Total Rounds(14) |
| Putts per Round - Round 2 | 28.50 | - | Total Putts(399) | Total Rounds(14) |
| Putts per Round - Round 3 | 29.11 | - | Total Putts(262) | Total Rounds(9) |
| Putts per Round - Round 4 | 28.75 | - | Total Putts(230) | Total Rounds(8) |
| One-Putt Percentage | 39.26% | - | # of 1 putts(318) | # of holes(810) |
| Longest Putts | 51' 10 | 116 | Year/Tourn#(The American Express) | Round(3) |
| 3-Putt Avoidance | 2.72% | - | Total 3 Putts(22) | Total Holes (overall)(810) |
| Putting from - > 25' | 6.56% | - | Attempts(183) | Putts made(12) |
| Putting from - 20-25' | 10.64% | - | Attempts(47) | Putts made(5) |
| Putting from - 15-20' | 35.14% | - | Attempts(74) | Putts made(26) |
| Putting from - 10-15' | 31.68% | - | Attempts(101) | Putts made(32) |
| Putting - Inside 10' | 87.24% | - | Attempts(682) | Putts made(595) |
| Putting from 10' | 43.24% | - | Attempts(37) | |
| Putting from 9' | 46.15% | - | Attempts(26) | |
| Putting from 8' | 60.00% | - | Attempts(30) | |
| Putting from 7' | 51.43% | - | Attempts(35) | |
| Putting from 6' | 75.76% | - | Attempts(33) | |
| Putting from 5' | 76.47% | - | Attempts(51) | |
| Putting from 4-8' | 67.11% | - | Attempts(149) | Putts made(100) |
| Putting from 4' | 95.16% | - | Attempts(62) | |
| Putting from 3' | 100.00% | - | Attempts(408) | |
| Average Distance of Putts made | 78' 9 | - | Total Dist. (inches)(35,907) | Total Rounds(38) |
| Approach Putt Performance | 2' 1 | - | Attempts(402) | |
| Scoring Average (Adjusted) | 70.646 | - | Total Strokes(3,118) | Total Adjustment(61.053) |
| Scoring Average (Actual) | 69.29 | - | Total Strokes(3,118) | Total Rounds(45) |
| Lowest Round | 64 | 121 | Tourn/Course(Butterfield Ber) | Round(2) |
| Birdie Average | 4.09 | - | # of Birdies(184) | Total Rounds(45) |
| Total Birdies | 184 | - | ||
| Eagles (Holes per) | 81.0 | - | # of Holes(810) | # of Eagles(10) |
| Total Eagles | 10 | - | ||
| Par Breakers | 23.95% | - | # Birdies/Eagles(194) | # Holes(810) |
| Bounce Back | 22.68% | - | ||
| Par 3 Birdie or Better Leaders | 15.26% | - | Par 3 Birdies or Better(29) | Par 3 Holes(190) |
| Par 4 Birdie or Better Leaders | 20.17% | - | Par 4 Birdies or Better(93) | Par 4 Holes(461) |
| Par 5 Birdie or Better Leaders | 45.28% | - | Par 5 Birdies or Better(72) | Par 5 Holes(159) |
| Birdie or Better Percentage | 23.95% | - | Total Birdies(194) | Total Holes(810) |
| Bogey Avoidance | 12.47% | - | Bogeys(101) | Holes Played(810) |
| Final Round Scoring Average | 67.67 | - | Total Strokes(609) | Total Rounds(9) |
| Final Round Performance | 77.78% | - | ||
| Round 1 Scoring Average | 69.79 | - | Total Strokes(977) | Total Rounds(14) |
| Round 2 Scoring Average | 69.29 | - | Total Strokes(970) | Total Rounds(14) |
| Round 3 Scoring Average | 70.00 | - | Total Strokes(630) | Total Rounds(9) |
| Round 4 Scoring Average | 67.63 | - | Total Strokes(541) | Total Rounds(8) |
| Par 3 Scoring Average | 3.00 | - | Total Strokes(570) | Total Holes(190) |
| Par 4 Scoring Average | 3.94 | - | Total Strokes(1,818) | Total Holes(461) |
| Par 5 Scoring Average | 4.59 | - | Total Strokes(730) | Total Holes(159) |
| Front 9 Scoring Average | 34.80 | - | Total Strokes(1,566) | Total Holes(45) |
| Back 9 Scoring Average | 34.49 | - | Total Strokes(1,552) | Total Holes(45) |
| Early Scoring Average | 68.41 | - | Total Strokes(1,505) | Total Early Rounds(22) |
| Late Scoring Average | 70.13 | - | Total Strokes(1,613) | Total Late Rounds(23) |
| Consecutive Cuts | - | - | ||
| Current Streak without a 3-Putt | 21 | 280 | ||
| Consecutive Fairways Hit | 52 | 3 | Current Streak(14) | |
| Consecutive GIR | 18 | 88 | Current Streak(7) | Round(3) |
| Consecutive Sand Saves | 4 | 185 | Current Streak(1) | Round(2) |
| Best YTD 1-Putt or Better Streak | 7 | 100 | ||
| Best YTD Streak w/o a 3-Putt | 142 | 119 | Current Streak(21) | |
| YTD Par or Better Streak | 8 | 159 | ||
| Consecutive Par 3 Birdies | 2 | 115 | ||
| Consecutive Holes Below Par | 6 | 9 | ||
| Consecutive Birdies Streak | 6 | 7 | ||
| Consecutive Birdies/Eagles streak | 4 | 19 | ||
| Official Money | $1,004,625 | 121 | YTD Victories | |
| FedExCup Fall Points | 430 | 112 |